1. BB: BTC probably goes to 77xx to test lower BB become coming back upward. But the candlestick didn’t still really close so the push wasn’t strong enough, probably need to go sideway around 7725 to 8668 before hitting upper BB at 9611
2. MACD: the histogram showing 0 means there is a tight fight between sellers and buyers. The sellers wanna push the price deep down so that they can buy with a good price, but buyers are expecting to see BTC bullishing so whenever BTC hit this price they try to buy as much as they can, and waiting for some financial funds jump in with their giant pocket to push BTC to go up. Those 2 MACD lines cutting each other, wanna go down but it seems to be hard, if they really do go down its probly a disaster, because at 78xx can’t be a strong support so we can expect to buy at 74xx-75xx. If there is bad news price will hit harder down to 68xx
3. Stochatic 2 lines already cut each other and going up making stoch in over-sell area so uptrend is supported and I expect the price can go up today to make it a green candle stick
These are my own personal opinions, just for your reference, not an advice to make the entry for you #DYOR

Find the photo here http://i1376.photobucket.com/albums/ah36/axingame/btc%20273_zpsna4zastt_1.jpg

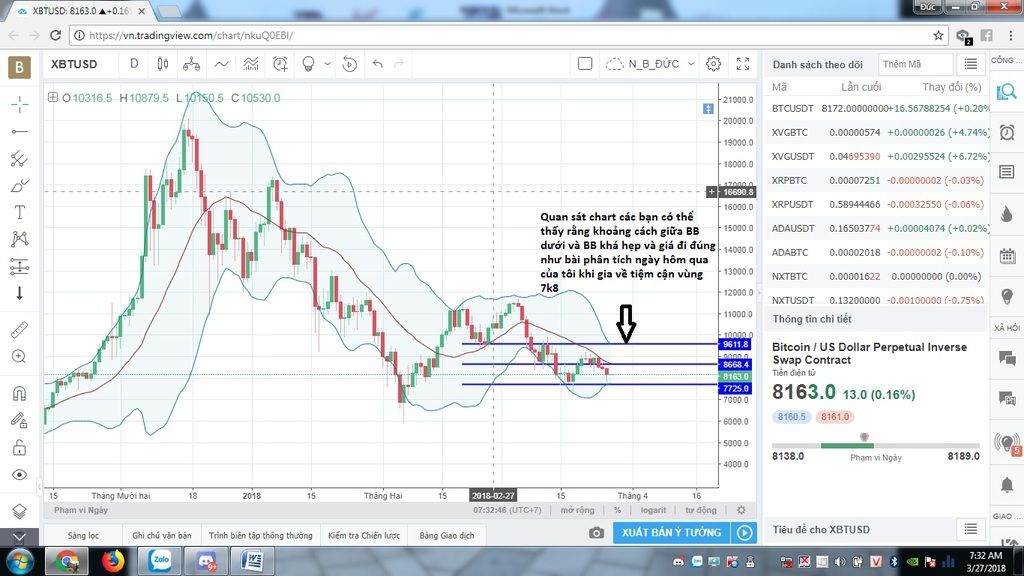